# OpenLayers之图层
看过之前的文章后,对于OpenLayers使用会有一个大致的了解。下面我们继续讲解OpenLayer的图层。
下面示例是以 OpenLayersV8.2.0版本作为依赖包。
# 图层
地图构建之后,我们常常需要加载路网、街道、湖泊、河流、标注等数据,通常情况,这些数据会以图层的形式渲染在地图canvas画布上。
OpenLayer中,图层(Layer)根据API方法划分,分为三种类型图层:瓦片图层(Tile)、图片图层(Image)、矢量图层(Vector)。
OpenLayers地图数据通过图层(Layer)进行组织渲染,然后通过数据源(Source)设置具体的地图数据来源。Source和Layer是一对一的关系,有一个Source,必然需要一个Layer,然后把Layer添加到Map上,就可以显示出来。
地图图层(Layer)有Image、Tile、Vector三大类的图层,相对应,地图数据根据数据源(Source)可分为Image、Tile、Vector三大类型的数据源类。
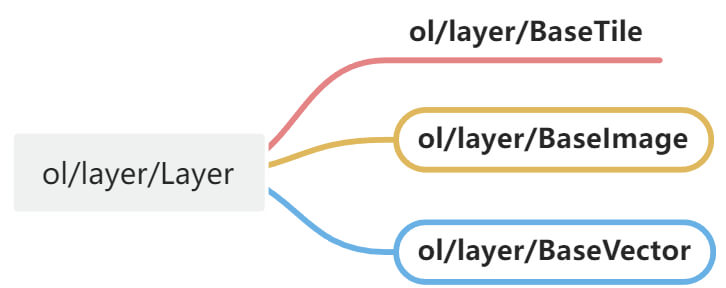
下面是关于[ol.layer.Layer](https://openlayers.org/en/latest/apidoc/module-ol_layer_Layer-Layer.html)的描述:
Base class from which all layer types are derived. This should only be instantiated in the case where a custom layer is added to the map with a custom render function. 派生所有图层类型的基类。这应该只在使用自定义渲染函数将自定义图层添加到地图的情况下实例化。
# Tile瓦片
对于在网格中提供预渲染平铺图像的图层源,这些网格按特定分辨率的缩放级别组织。
在Web端页面,地图成为一张平面地图,由于既要展示宏观信息,也要展示微观信息,所以对这张地图进行等级切分。
在最高级(zoom=0),信息最少,只用一张256x256像素的一张图片就可以;在下一级(zoom=1),信息量变多,用一张512x512像素的图片表示;以此类推,级别越低的像素越高。对每张图片,我们将其切分为单张256x256图片,称为瓦片(Tile)。
# source
ol.source.Tile最为复杂,因为多个服务提供商,多种标准等诸多原因,导致要支持世界上大多数的瓦片数据,就需要针对这些差异提供不同的Tile数据源支持。
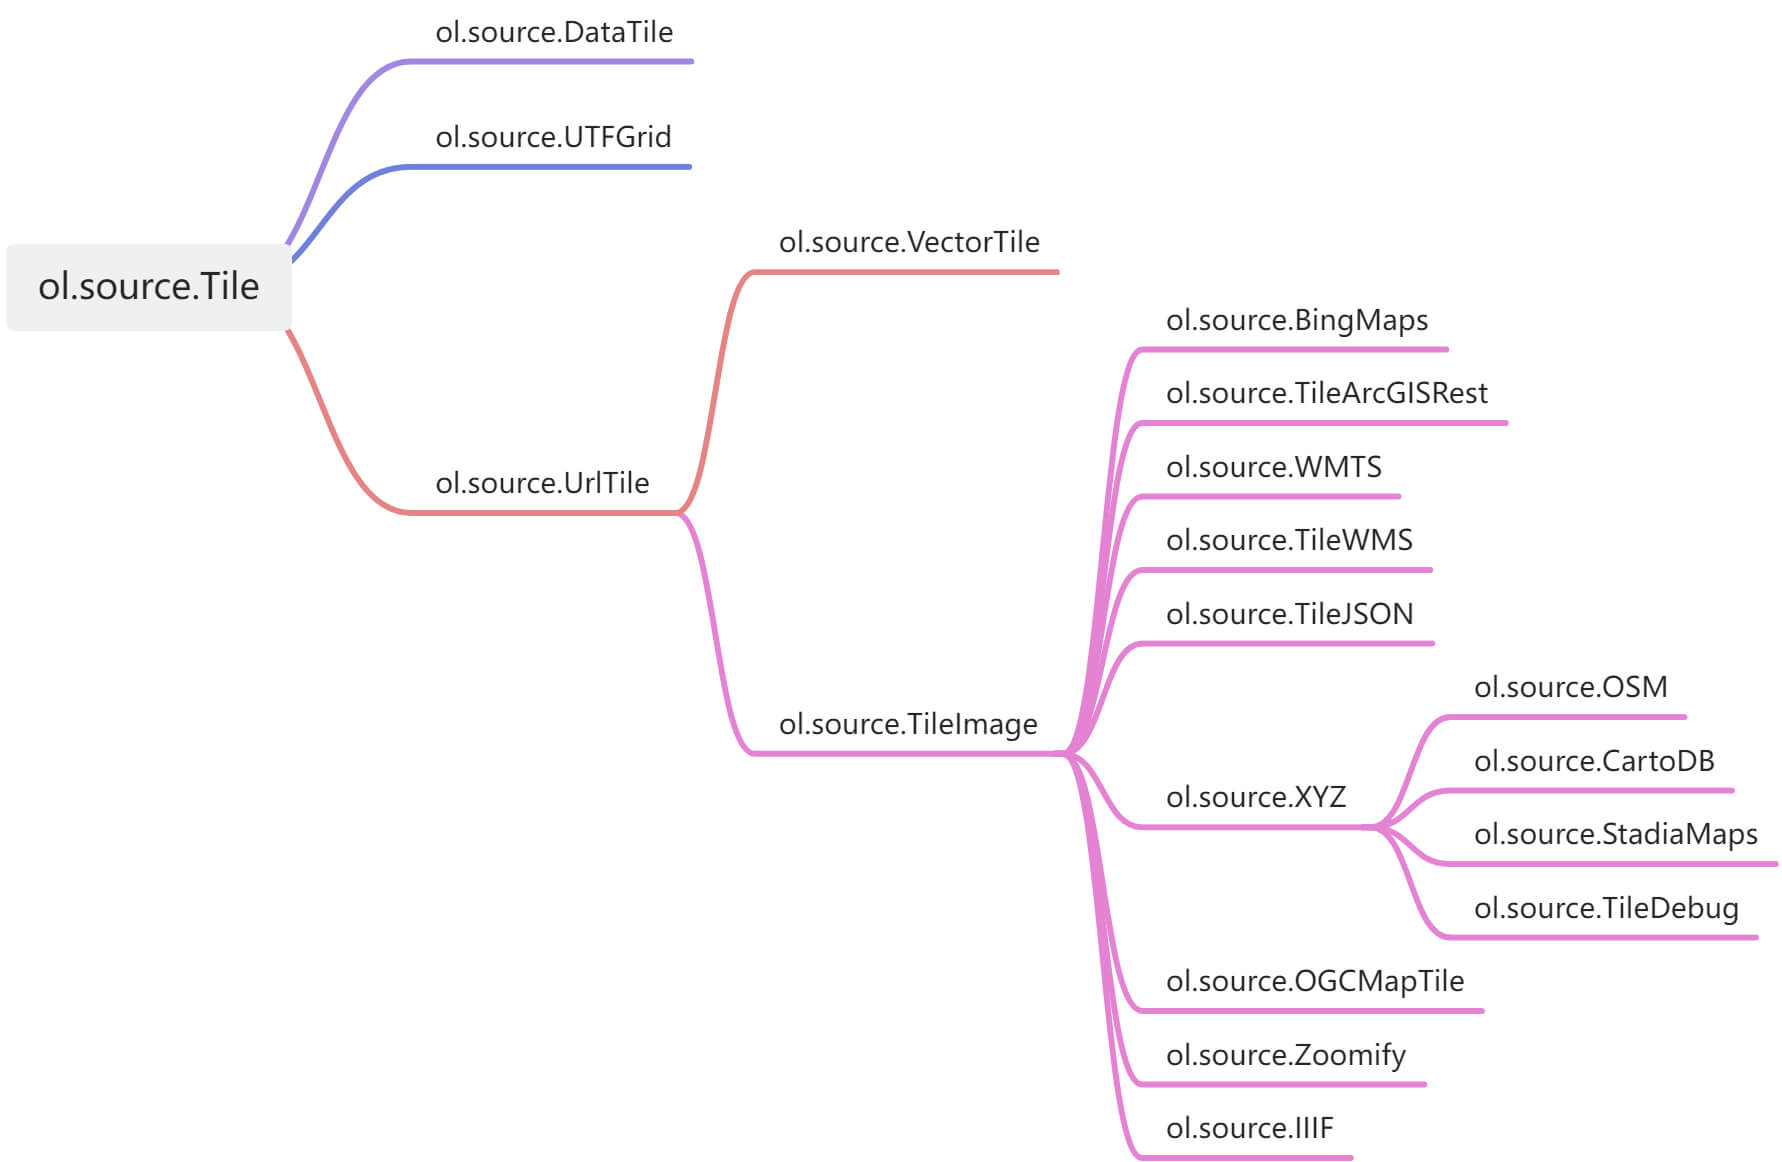
**ol.source.Tile**:Abstract base class。通常仅用于创建子类,不在应用程序中实例化;**ol.source.UrlTile**:提供基于http网络,划分为瓦片网格的瓦片基类数据源;[**ol.source.DataTile**](https://openlayers.org/en/v8.2.0/examples/data-tiles.html):支持数据源为数组类型瓦片数据;[**ol.source.UTFGrid**](https://openlayers.org/en/v8.2.0/examples/utfgrid.html):支持TileJSON格式加载的UTFGrid交互数据的图层源;
[ol.source.XYZ](https://openlayers.org/en/v8.2.0/apidoc/module-ol_source_XYZ-XYZ.html):支持各平台,XYZ格式的URL的瓦片数据(谷歌、高德、百度、Arcgis online等服务平台);[ol.source.TileArcGISRest](https://openlayers.org/en/v8.2.0/apidoc/module-ol_source_TileArcGISRest-TileArcGISRest.html):支持Arcgis Server的Rest服务瓦片;[ol.source.OSM](https://openlayers.org/en/v8.2.0/apidoc/module-ol_source_OSM-OSM.html):支持 OpenStreetMap;[ol.source.BingMaps](https://openlayers.org/en/v8.2.0/apidoc/module-ol_source_BingMaps-BingMaps.html):支持 必应地图;[ol.source.OGCMapTile](https://openlayers.org/en/v8.2.0/apidoc/module-ol_source_OGCMapTile-OGCMapTile.html):支持OGC地图瓦片服务;[ol.source.WMTS](https://openlayers.org/en/v8.2.0/apidoc/module-ol_source_WMTS-WMTS.html):支持WMTS数据格式瓦片服务;[ol.source.TileWMS](https://openlayers.org/en/v8.2.0/apidoc/module-ol_source_wms.html):支持WMS数据格式瓦片服务;[ol.source.Zoomify](https://openlayers.org/en/v8.2.0/apidoc/module-ol_source_Zoomify-Zoomify.html):Zoomify格式的瓦片数据的层源(支持Zoomify和Internet Imaging协议);[ol.source.VectorTile](https://openlayers.org/en/v8.2.0/apidoc/module-ol_source_VectorTile-VectorTile.html):支持矢量瓦片服务;(尽管是矢量,但是还是划入Tile数据源)[ol.source.TileJSON](https://openlayers.org/en/v8.2.0/apidoc/module-ol_source_TileJSON-TileJSON.html):支持TileJSON格式瓦片数据;
官方文档:BingMaps (opens new window)、DataTile (opens new window)、UTFGrid (opens new window)、XYZ (opens new window)、TileArcGISRest (opens new window)、OSM (opens new window)、[BingMaps](https://openlayers.org/en/v8.2.0/apidoc/module-ol_source_BingMaps-BingMaps.html)、OGCMapTile (opens new window)、WMTS (opens new window)、TileWMS (opens new window)、OGCMapTile (opens new window)、Zoomify (opens new window)、IIIF (opens new window)、TileJSON (opens new window)、VectorTile (opens new window);更多示例查看官网。
# 示例
ol.source.BingMaps依赖的key可以到这里申请 https://www.bingmapsportal.com (opens new window)。
<!DOCTYPE html>
<html lang="en">
<head>
<meta charset="UTF-8">
<title>访问 Map</title>
<link rel="stylesheet" href="./8.2.0/theme/ol.css">
<script src="./8.2.0/en/latest/ol/dist/ol.js"></script>
<!-- 不想下载就直接用下面的 -->
<!-- <script src="https://cdn.jsdelivr.net/npm/ol@v8.2.0/dist/ol.js"></script>
<link rel="stylesheet" href="https://cdn.jsdelivr.net/npm/ol@v8.2.0/ol.css"> -->
</head>
<body>
<div id="map" style="height: 600px; border: 6px solid;"></div>
<script>
let map = new ol.Map({
target: 'map',
layers: [
new ol.layer.Tile({
// source: new ol.source.OSM()
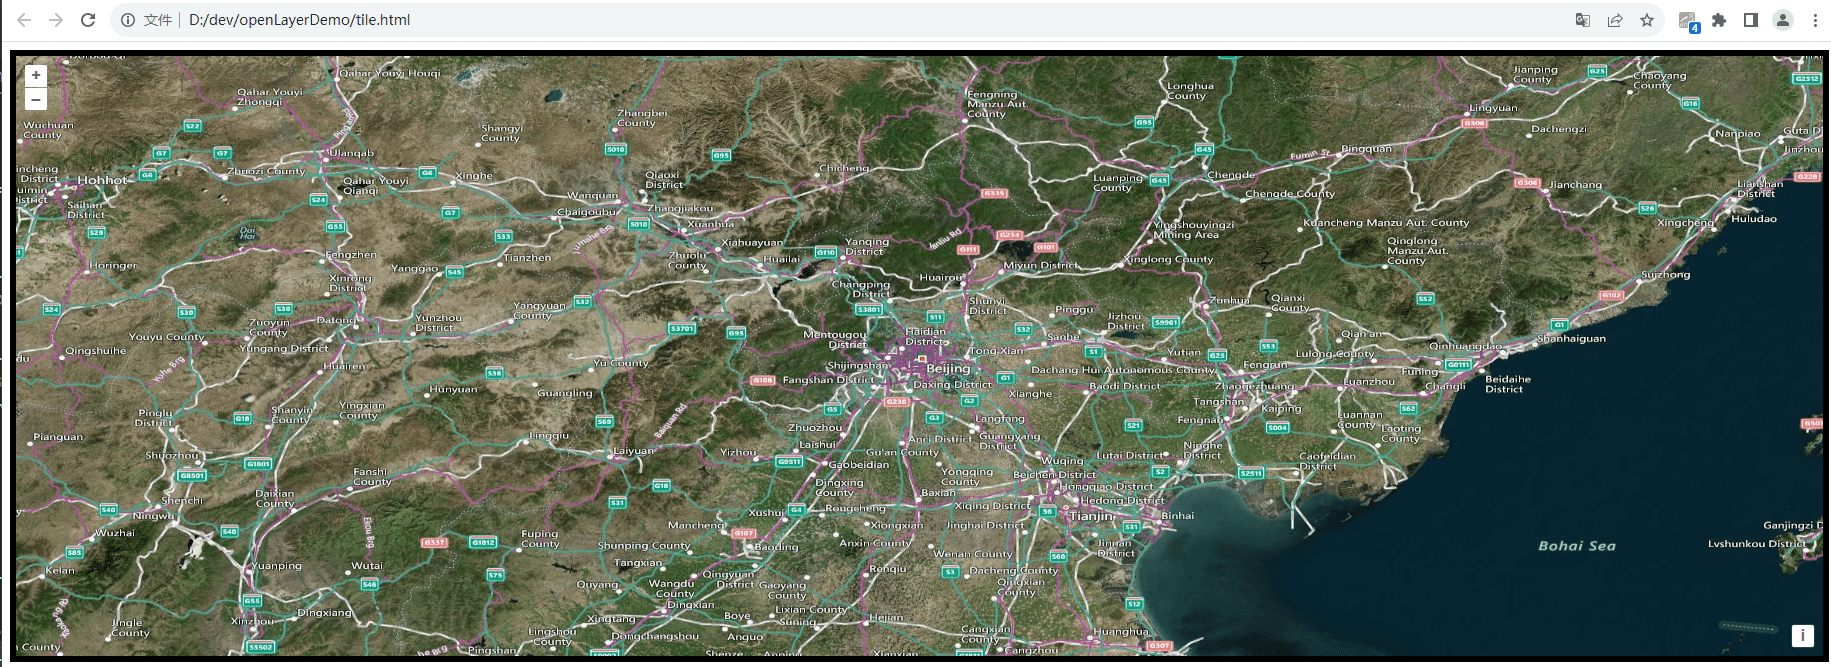
source: new ol.source.BingMaps({
key: '// Bing Map的key,可以去官网申请',
imagerySet: 'AerialWithLabels' // 指定加载的图层名,还可以替换为'Aerial'或'Road'
})
}),
],
view: new ol.View({
center: [116.39, 39.91],
zoom: 8,
projection:'EPSG:4326'
})
});
</script>
</body>
</html>
2
3
4
5
6
7
8
9
10
11
12
13
14
15
16
17
18
19
20
21
22
23
24
25
26
27
28
29
30
31
32
33
34
35
36
37
38
BingMaps的 key申请到之后,就可以预览啦!
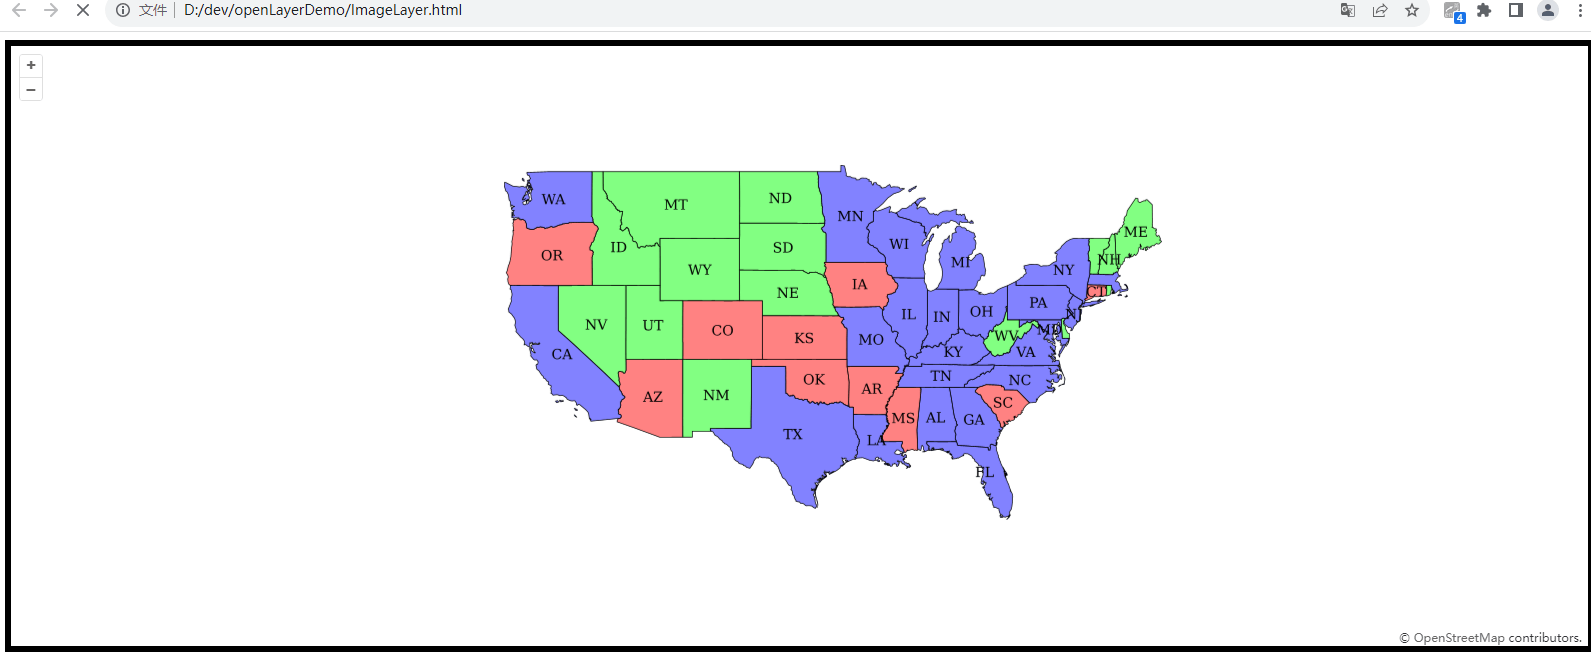
# Image图片
可用于任意范围和分辨率的服务器渲染图像
Image图层相比较Tile图层,Image对应的是一整张大图片,而不像瓦片那样很多张小图片,从而无需切片,也可以加载一些地图,适用于一些小场景地图。
# source
图层ol.layer.Image与 数据源ol.source.Image对应:
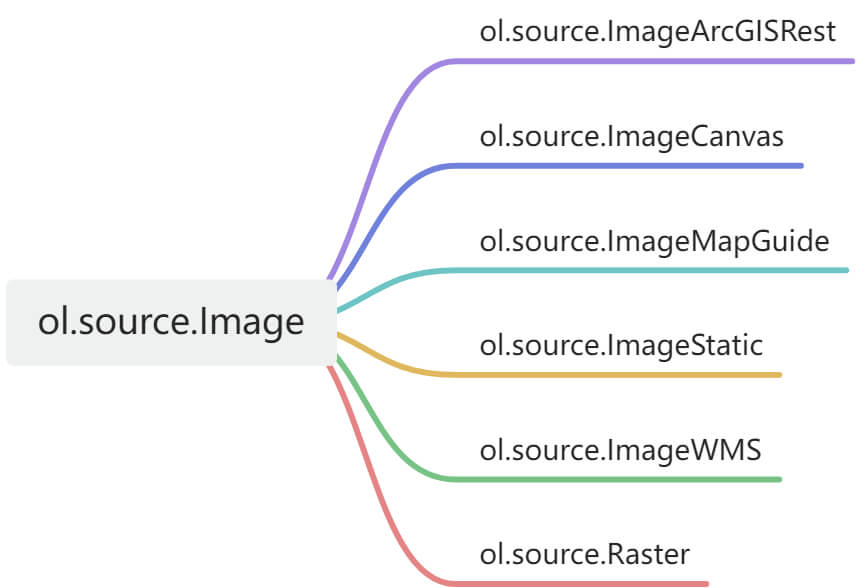
**ol.source.Image**:Base class for sources providing a single image;
[ol.source.ImageArcGISRest](https://openlayers.org/en/v8.2.0/apidoc/module-ol_source_ImageArcGISRest-ImageArcGISRest.html):支持Arcgis Server的Rest服务图片;ol.source.ImageCanvas:支持添加Canvas图层作为图片;示例 (opens new window)ol.source.ImageMapGuide:支持Mapguide 服务器提供的图片;ol.source.ImageStatic:支持静态图片;ol.source.ImageWMS:支持WMS服务图片;ol.source.Raster:光栅;(这个不知道怎么用)
官方示例:ImageStatic (opens new window)、Single ImageWMS (opens new window)、ImageArcGISRest (opens new window)、ImageWMS (opens new window)、ImageMapGuide (opens new window)、Raster (opens new window);更多示例查看官网。
# 示例
<!DOCTYPE html>
<html lang="en">

<head>
    <meta charset="UTF-8">
    <title>访问 Map</title>
    <link rel="stylesheet" href="./8.2.0/theme/ol.css">
    <script src="./8.2.0/en/latest/ol/dist/ol.js"></script>
  	<!-- 不想下载就直接用下面的 -->
    <!-- <script src="https://cdn.jsdelivr.net/npm/ol@v8.2.0/dist/ol.js"></script>
		<link rel="stylesheet" href="https://cdn.jsdelivr.net/npm/ol@v8.2.0/ol.css"> -->
</head>

<body>
    <div id="map" style="height: 600px; border: 6px solid;"></div>

    <script>
        let map = new ol.Map({
            target: 'map',
            layers: [
                new ol.layer.Tile({
                    source: new ol.source.OSM()
                }),
                new ol.layer.Image({
                    // 范围
                    extent: [-13884991, 2870341, -7455066, 6338219],
                    // WMS图片
                    source: new ol.source.ImageWMS({
                        url: 'https://ahocevar.com/geoserver/wms',
                        params: {'LAYERS': 'topp:states'},
                        ratio: 1,
                      	// 服务类型
                        serverType: 'geoserver',
                    }),
                }),
            ],
            view: new ol.View({
                center: [-10997148, 4569099],
                zoom: 4,
            })
        });
    </script>
</body>

</html>
2
3
4
5
6
7
8
9
10
11
12
13
14
15
16
17
18
19
20
21
22
23
24
25
26
27
28
29
30
31
32
33
34
35
36
37
38
39
40
41
42
43
44
45
加载WMS图片作为地图底图,下面我们可以预览效果啦!
# Vector矢量
瓦片、图片与矢量相比较,前两个基本就是图片,后者主要是点、线、面等数据集合。
- 点数据可直接用坐标值描述,每个点是由单独的X,Y坐标定义的。
- 线数据可用均匀或不均匀间隔的顺序坐标链来描述,线是一系列(至少2个)相连的折点或点的集合。
- 面状数据(或多边形数据)可用边界线来描述,面是由3个或以上的折点组成的连续封闭图形。
常用的矢量数据格式有GeoJSON、TopoJSON、KML、GML、shapfile等。ol.source.Vector类是矢量数据源基类,为矢量图层ol.layer.Vector类提供具体的数据来源,包括直接组织或读取的矢量数据、远程数据源的矢量数据(即通过url设置数据源路径)。
# source
图层ol.layer.Vector与 数据源ol.source.Vector对应,source数据源如下:

[**ol.source.Vector**](https://openlayers.org/en/v8.2.0/apidoc/module-ol_source_Vector-VectorSource.html):提供矢量图层的要素来源;(这里的要素我们会在后面文章说道)
[ol.source.Cluster](https://openlayers.org/en/v8.2.0/apidoc/module-ol_source_Cluster-Cluster.html):对矢量数据进行聚合的图层源;(聚合,在后篇文章会使用)
官方示例:Cluster (opens new window)、Vector (opens new window)、Dynamic clusters (opens new window);更多示例查看官网。
# 示例
<!DOCTYPE html>
<html lang="en">
<head>
<meta charset="UTF-8">
<title>访问 Map</title>
<link rel="stylesheet" href="./8.2.0/theme/ol.css">
<script src="./8.2.0/en/latest/ol/dist/ol.js"></script>
<!-- 不想下载就直接用下面的 -->
<!-- <script src="https://cdn.jsdelivr.net/npm/ol@v8.2.0/dist/ol.js"></script>
<link rel="stylesheet" href="https://cdn.jsdelivr.net/npm/ol@v8.2.0/ol.css"> -->
</head>
<body>
<div id="map" style="height: 600px; border: 6px solid;"></div>
<div id="info"> </div>
<script>
const vectorLayer = new ol.layer.Vector({
background: '#1a2b39',
// GeoJSON格式
source: new ol.source.Vector({
url: 'https://openlayers.org/data/vector/ecoregions.json',
// url: 'https://geo.datav.aliyun.com/areas_v2/bound/100000_full.json',
format: new ol.format.GeoJSON(),
}),
style: {
'fill-color': ['string', ['get', 'COLOR'], '#eee'],
}
})
let map = new ol.Map({
target: 'map',
layers: [
vectorLayer
],
view: new ol.View({
center: [-10997148, 4569099],
zoom: 4,
})
});
</script>
</body>
</html>
2
3
4
5
6
7
8
9
10
11
12
13
14
15
16
17
18
19
20
21
22
23
24
25
26
27
28
29
30
31
32
33
34
35
36
37
38
39
40
41
42
43
加载GeoJSON格式矢量数据源上图,看看预览效果吧!
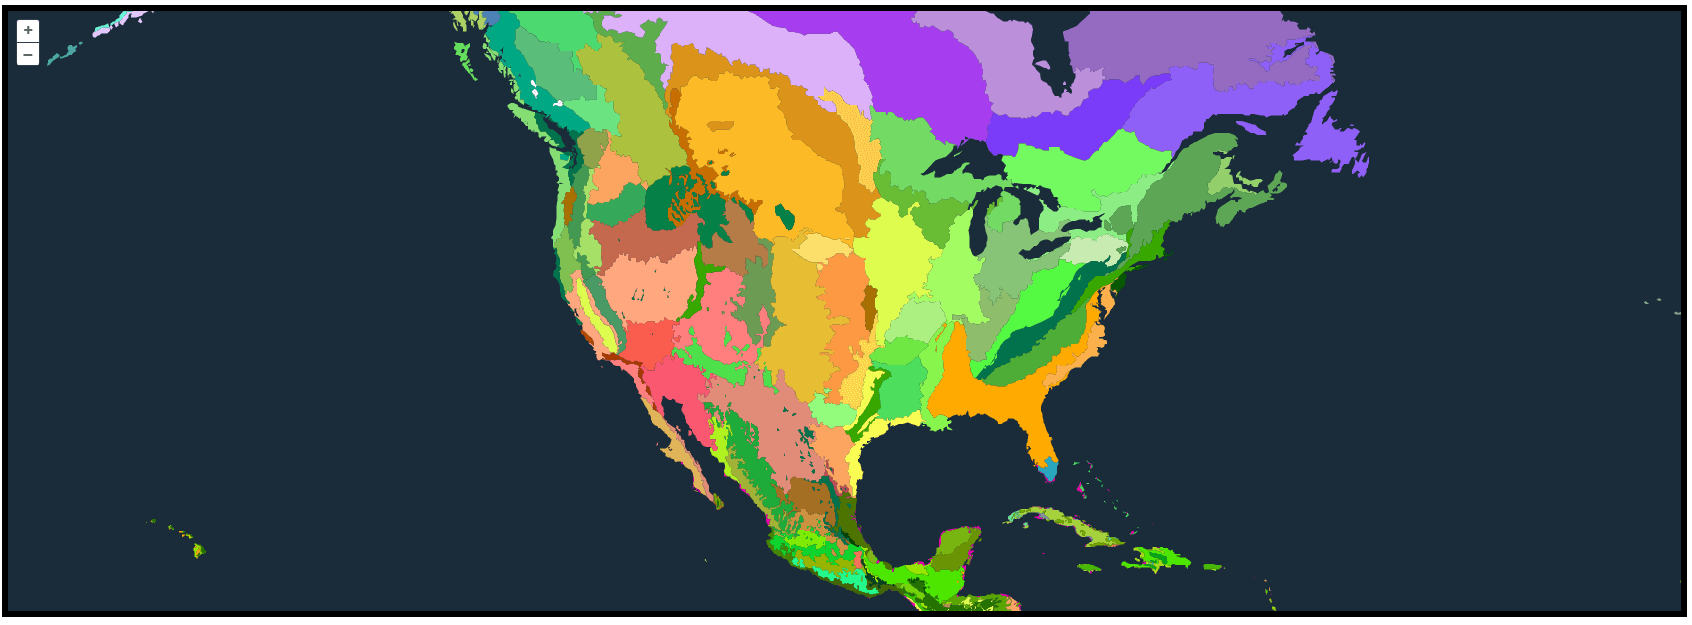
颜色和边界数据,都包含在GeoJSON数据中心,有兴趣可以看看数据源数据结构。
# 总结
- OpenLayers图层(Layer)分为三类瓦片(ol.layer.Tile)、图片(ol.layer.Image)、矢量(ol.layer.Vector);
- OpenLayers中数据源(Source)为图层(Layer)提供来源数据;
- OpenLayers中Source和Layer是一对一的关系,有一个Layer,必然需要一个Source;
- 由于不同服务商提供不同数据格式,所以瓦片数据源种类最多;
- 在GIS中,瓦片主要是图片切片,矢量主要是地理要素的空间坐标与属性信息;
武汉工作,会点Web,擅长Javascript.
技术或工作问题交流,可联系微信:1169170165.