# OpenLayers之矢量图形
看过之前的文章,你对OpenLayers应该有了很大的了解。关于矢量图形,你应该有了一定的概念,这一篇我们再总结下,并讲解OpenLayer如何创建矢量图形。
下面示例是以 OpenLayersV8.2.0版本 作为依赖包。
# 矢量图形
在之前讲解点标记时,我们说到过矢量图形。GIS地图上,日常开发上图的点、线、面、几何体都属于矢量图形。openlayer中矢量图形是通过矢量数据,配合要素(Feature)和几何(Geometry)共同构建。如果没看过点标记创建,可以先去看看,再看这篇。
矢量是具有一定大小和方向的量,数学上和物理上也叫向量。 在纸上用笔划一条线段,绘图机在纸上画一条线段,计算机图形中一条有向线段,都是一个直观的矢量。 线段长度表示大小,线段端点的顺序表示方向。 有向线段用一系列有序特征点表示,有向线段集合就构成了图形。
矢量数据就是代表地图图形的各离散点平面坐标(x,y)的有序集合,矢量数据结构是一种最常见的图形数据结构,主要用于表示地图图形元素几何数据之间及其与属性数据之间的相互关系。
# 矢量点
点是空间上不可再分的地理实体,可以是具体的也可以是抽象的,如地物点、文本位置点或线段网络的结点等,如果点是一个与其它信息无关的符号,则记录时应包括符号类型、大小、方向等有关信息;如果点是文本实体,记录的数据应包括字符大小、字体、排列方式、比例、方向以及与其它非图形属性的联系方式等信息。
矢量点在点标记已经有过介绍,现在不在单独解释,下面看看它的用法:
const coordinate = [
    [
        116.38390602111816,
        39.91933196682435
    ],
    [
        116.40862525939941,
        39.89048282729144
    ]
]
// 创建Feature要素
const features = coordinate.map((item) => {
    const Feature = new ol.Feature({
        // 创建geometry
        geometry: new ol.geom.Point(item),
        name: 'Point'
    })
    return Feature;
})
2
3
4
5
6
7
8
9
10
11
12
13
14
15
16
17
18
19
通过Feature要素 和 Geometry几何,就可以创建矢量点实例,如果再配合上Style样式,我们就可以随意修改矢量点的填充、边界、半径等。
# 示例
<!DOCTYPE html>
<html lang="en">

<head>
    <meta charset="UTF-8">
    <title>访问 Map</title>
    <link rel="stylesheet" href="./8.2.0/theme/ol.css">
    <script src="./8.2.0/en/latest/ol/dist/ol.js"></script>
    <!-- <script src="https://cdn.jsdelivr.net/npm/ol@v8.2.0/dist/ol.js"></script>
    <link rel="stylesheet" href="https://cdn.jsdelivr.net/npm/ol@v8.2.0/ol.css"> -->
</head>

<body>
    <div id="map" style="height: 95vh; border: 6px solid;"></div>

    <script>
        const coordinate = [
            [
                116.38390602111816,
                39.91933196682435
            ],
            [
                116.40862525939941,
                39.89048282729144
            ]
        ]
        let map = new ol.Map({
            target: 'map',
            layers: [
                new ol.layer.Tile({
                    // source: new ol.source.OSM()
                    source: new ol.source.BingMaps({
                        key: 'Aud1dM5V1tT5Yvg2uX8Hp5ftaZZ4stEuJZ8i7IO1KSyLFj9A4UuamHK6_tUKEcGe',
                        imagerySet: 'Road'  // 指定加载的图层名,还可以替换为'AerialWithLabels' 'Aerial'或'Road'
                    })
                }),
            ],
            view: new ol.View({
                center: [116.39, 39.91],
                zoom: 13,
                projection: 'EPSG:4326'
            })
        });

        // 创建Style样式
        const iconStyle = new ol.style.Style({
            image: new ol.style.Circle({
                fill: new ol.style.Fill({
                    color: 'red',
                }),
                stroke: new ol.style.Stroke({
                    color: '#3399CC',
                    width: 1.25,
                }),
                radius: 5,
            }),
        })
        // 创建Feature要素
        const features = coordinate.map((item) => {
            const Feature = new ol.Feature({
                // 创建geometry
                geometry: new ol.geom.Point(item),
                name: 'Point'
            })
            return Feature;
        })
        // 创建Vector图层
        const vectorLayer = new ol.layer.Vector({
            source: new ol.source.Vector({
                features: features
            }),
            style: iconStyle
        })
        // features.forEach((item) => vectorLayer.getSource().addFeature(item))
        map.addLayer(vectorLayer);
        // Point矢量点点击
        map.on('click', (evt) => {
            const Feature = map.forEachFeatureAtPixel(evt.pixel, (feature) => {
                return feature
            })
            if (Feature && Feature.get('name') === 'Point') {
                console.log('Point');
            }
        })
    </script>
</body>

</html>
2
3
4
5
6
7
8
9
10
11
12
13
14
15
16
17
18
19
20
21
22
23
24
25
26
27
28
29
30
31
32
33
34
35
36
37
38
39
40
41
42
43
44
45
46
47
48
49
50
51
52
53
54
55
56
57
58
59
60
61
62
63
64
65
66
67
68
69
70
71
72
73
74
75
76
77
78
79
80
81
82
83
84
85
86
87
88
创建完矢量点后,给它再设置样式,最后添加到地图上。下面看看矢量点上图效果。
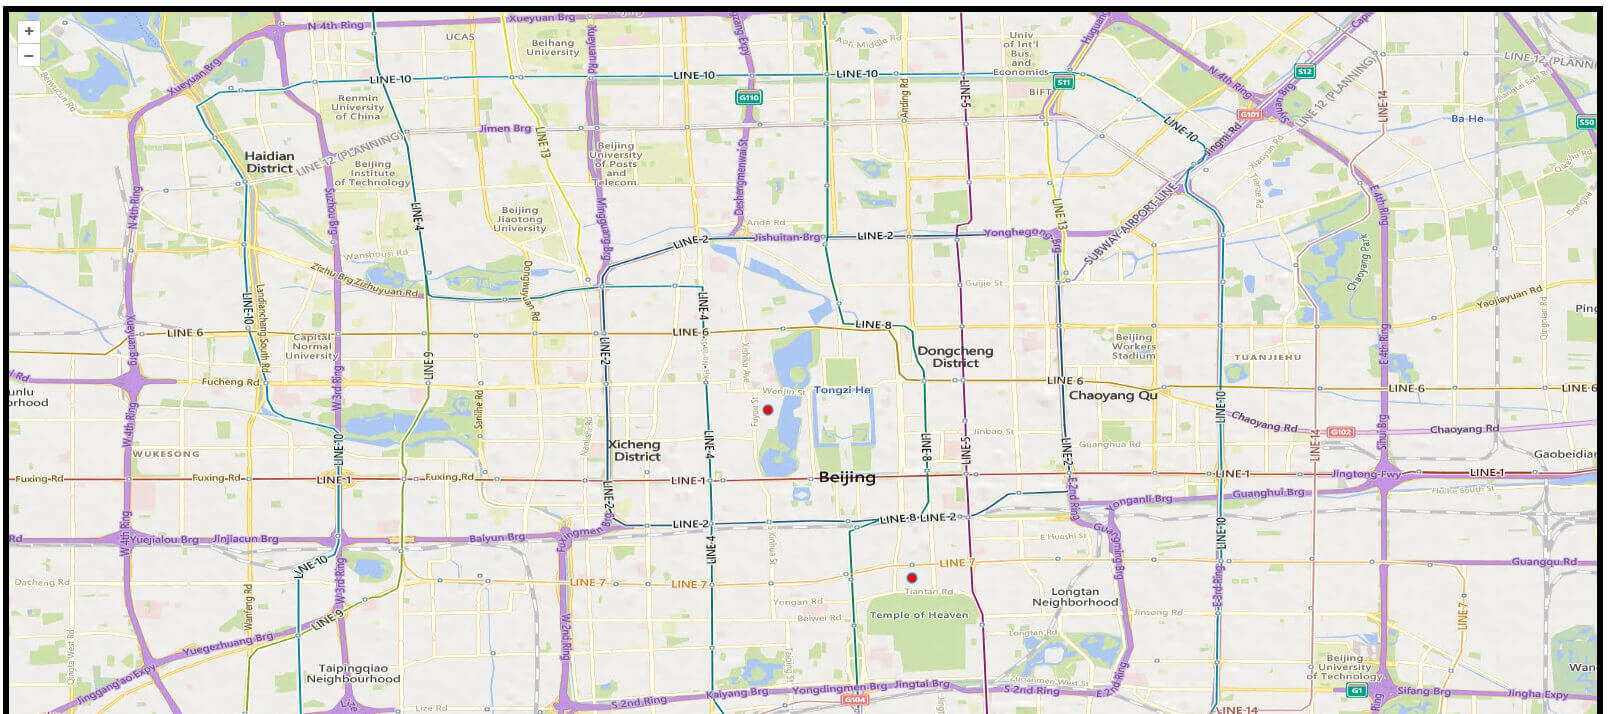
上图中的小红点,就是矢量点的上图效果。如果不太理解Feature要素 、 Geometry几何和Style样式,可以移步之前的文章:OpenLayers之点标记;
# 矢量线
线实体可以定义为直线元素组成的各种线性要素,直线元素由两对x,y坐标定义。 最简单的线实体只存储它的起止点坐标、属性、显示符等有关数据。
const coordinate = [
  [
    116.38390602111816,
    39.91933196682435
  ],
  [
    116.40862525939941,
    39.89048282729144
  ]
];
// 创建Feature要素
const feature = new ol.Feature({
  // 创建geometry
  geometry: new ol.geom.LineString(coordinate),
  name: 'Line'
})
2
3
4
5
6
7
8
9
10
11
12
13
14
15
16
在openlayer中,矢量线Feature要素的Geometry几何定义,通过ol.geom.LineStringAPI完成,创建线的几何形状。
# 示例
<!DOCTYPE html>
<html lang="en">

  <head>
    <meta charset="UTF-8">
    <title>访问 Map</title>
    <link rel="stylesheet" href="./8.2.0/theme/ol.css">
    <script src="./8.2.0/en/latest/ol/dist/ol.js"></script>
    <!-- <script src="https://cdn.jsdelivr.net/npm/ol@v8.2.0/dist/ol.js"></script>
    <link rel="stylesheet" href="https://cdn.jsdelivr.net/npm/ol@v8.2.0/ol.css"> -->
  </head>

  <body>
    <div id="map" style="height: 95vh; border: 6px solid;"></div>

    <script>
      const coordinate = [
        [
          116.38390602111816,
          39.91933196682435
        ],
        [
          116.40862525939941,
          39.89048282729144
        ]
      ]
      let map = new ol.Map({
        target: 'map',
        layers: [
          new ol.layer.Tile({
            // source: new ol.source.OSM()
            source: new ol.source.BingMaps({
              key: 'Aud1dM5V1tT5Yvg2uX8Hp5ftaZZ4stEuJZ8i7IO1KSyLFj9A4UuamHK6_tUKEcGe',
              imagerySet: 'Road'  // 指定加载的图层名,还可以替换为'AerialWithLabels' 'Aerial'或'Road'
            })
          }),
        ],
        view: new ol.View({
          center: [116.39, 39.91],
          zoom: 13,
          projection: 'EPSG:4326'
        })
      });

      // 创建Style样式
      const lineStyle = new ol.style.Style({
        stroke: new ol.style.Stroke({
          color: '#3399CC',
          width: 6,
        }),
      })
      // 创建Feature要素
      const feature = new ol.Feature({
        // 创建geometry
        geometry: new ol.geom.LineString(coordinate),
        name: 'Line'
      })
      // 创建Vector图层
      const vectorLayer = new ol.layer.Vector({
        source: new ol.source.Vector({
          features: [feature]
        }),
        style: lineStyle
      })
      map.addLayer(vectorLayer);
      // Point矢量点点击
      map.on('click', (evt) => {
        const Feature = map.forEachFeatureAtPixel(evt.pixel, (feature) => {
          return feature
        })
        if (Feature && Feature.get('name') === 'Point') {
          console.log('Point');
        }
      })
    </script>
  </body>

</html>
2
3
4
5
6
7
8
9
10
11
12
13
14
15
16
17
18
19
20
21
22
23
24
25
26
27
28
29
30
31
32
33
34
35
36
37
38
39
40
41
42
43
44
45
46
47
48
49
50
51
52
53
54
55
56
57
58
59
60
61
62
63
64
65
66
67
68
69
70
71
72
73
74
75
76
77
78
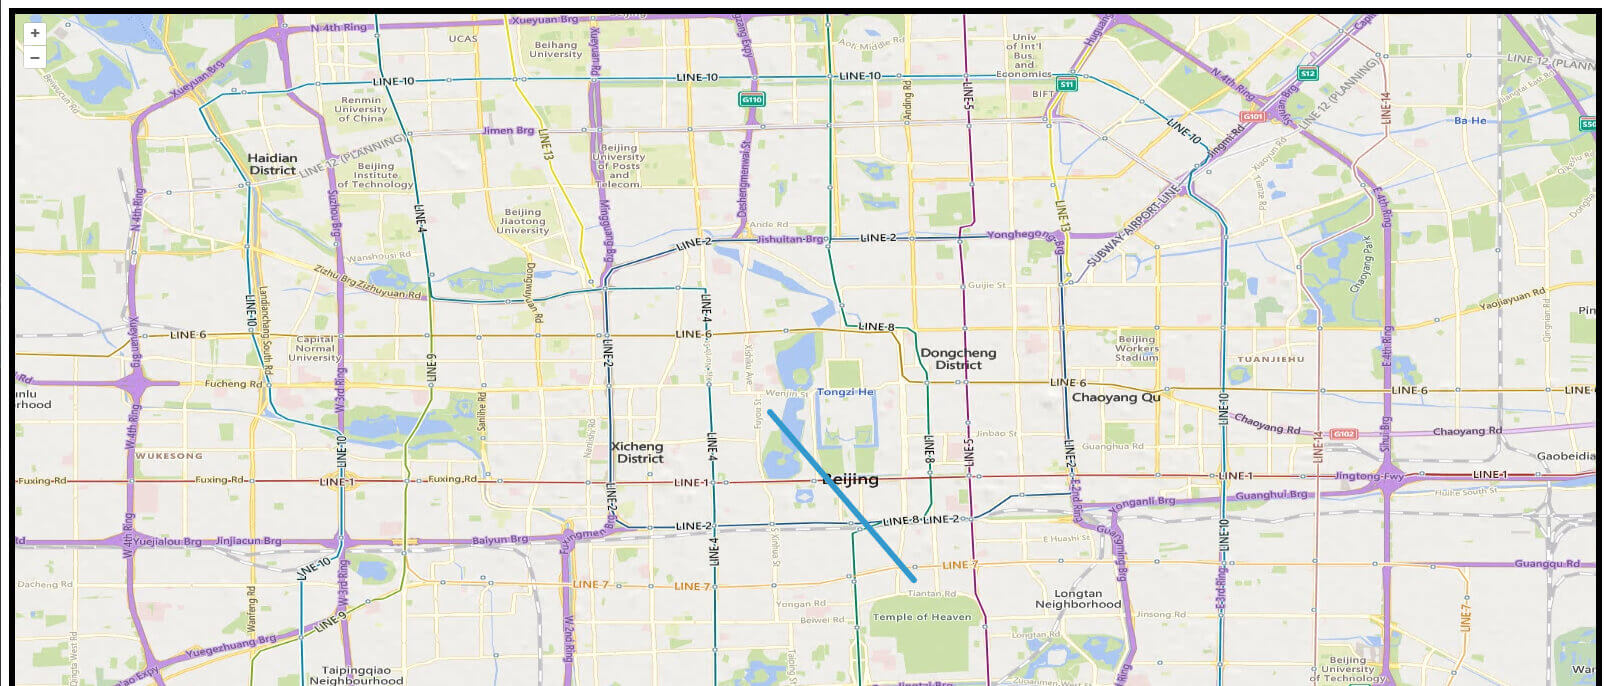
来看看矢量线上图效果!
# 矢量面
多边形矢量编码,不但要表示位置和属性,更重要的是能表达区域的拓扑特征,如形状、邻域和层次结构等,以便恢复这些基本的空间单元可以作为专题图的资料进行显示和操作,由于要表示的信息十分丰富,基于多边形的运算多而复杂,因此多边形矢量编码比点和线实体的矢量编码要复杂得多,也更为重要。
// 尽管是三角形,但是有四个点,最后一个点是结束点,和第一个点一致
const coordinate = [
    [
        116.37008728027344,
        39.92109744792178
    ],
    [
        116.31773056030273,
        39.880772341194636
    ],
    [
        116.43566192626953,
        39.86841741487823
    ],
    [
        116.37008728027344,
        39.92109744792178
    ]
]
// 创建Feature要素
const feature = new ol.Feature({
    // 创建geometry
    geometry: new ol.geom.Polygon([coordinate]),
    name: 'Polygon'
})
2
3
4
5
6
7
8
9
10
11
12
13
14
15
16
17
18
19
20
21
22
23
24
25
在给定矢量面的坐标位置信息时,需要构成一个闭合的面,最后一个点,需要与第一个点一致。
# 示例
<!DOCTYPE html>
<html lang="en">

<head>
    <meta charset="UTF-8">
    <title>访问 Map</title>
    <link rel="stylesheet" href="./8.2.0/theme/ol.css">
    <script src="./8.2.0/en/latest/ol/dist/ol.js"></script>
    <!-- <script src="https://cdn.jsdelivr.net/npm/ol@v8.2.0/dist/ol.js"></script>
    <link rel="stylesheet" href="https://cdn.jsdelivr.net/npm/ol@v8.2.0/ol.css"> -->
</head>

<body>
    <div id="map" style="height: 95vh; border: 6px solid;"></div>

    <script>
  			// 尽管是三角形,但是有四个点,最后一个点是结束点,和第一个点一致
        const coordinate = [
            [
                116.37008728027344,
                39.92109744792178
            ],
            [
                116.31773056030273,
                39.880772341194636
            ],
            [
                116.43566192626953,
                39.86841741487823
            ],
            [
                116.37008728027344,
                39.92109744792178
            ]
        ]
        let map = new ol.Map({
            target: 'map',
            layers: [
                new ol.layer.Tile({
                    // source: new ol.source.OSM()
                    source: new ol.source.BingMaps({
                        key: 'Aud1dM5V1tT5Yvg2uX8Hp5ftaZZ4stEuJZ8i7IO1KSyLFj9A4UuamHK6_tUKEcGe',
                        imagerySet: 'Road'  // 指定加载的图层名,还可以替换为'AerialWithLabels' 'Aerial'或'Road'
                    })
                }),
            ],
            view: new ol.View({
                center: [116.39, 39.91],
                zoom: 13,
                projection: 'EPSG:4326'
            })
        });
        map.on('click', (e) => console.log(e));

        // 创建Style样式
        const lineStyle = new ol.style.Style({
            stroke: new ol.style.Stroke({
                color: '#3399CC',
                width: 4
            }),
            fill: new ol.style.Fill({
                color: 'rgba(255,255,255, 0.7)'
            }),
        })
        // 创建Feature要素
        const feature = new ol.Feature({
            // 创建geometry
            geometry: new ol.geom.Polygon([coordinate]),
            name: 'Polygon'
        })
        console.log(feature)
        // 创建Vector图层
        const vectorLayer = new ol.layer.Vector({
            source: new ol.source.Vector({
                features: [feature]
            }),
            style: lineStyle
        })
        map.addLayer(vectorLayer);
        // Point矢量点点击
        map.on('click', (evt) => {
            const Feature = map.forEachFeatureAtPixel(evt.pixel, (feature) => {
                return feature
            })
            if (Feature && Feature.get('name') === 'Point') {
                console.log('Point');
            }
        })
    </script>
</body>

</html>
2
3
4
5
6
7
8
9
10
11
12
13
14
15
16
17
18
19
20
21
22
23
24
25
26
27
28
29
30
31
32
33
34
35
36
37
38
39
40
41
42
43
44
45
46
47
48
49
50
51
52
53
54
55
56
57
58
59
60
61
62
63
64
65
66
67
68
69
70
71
72
73
74
75
76
77
78
79
80
81
82
83
84
85
86
87
88
89
90
91
92
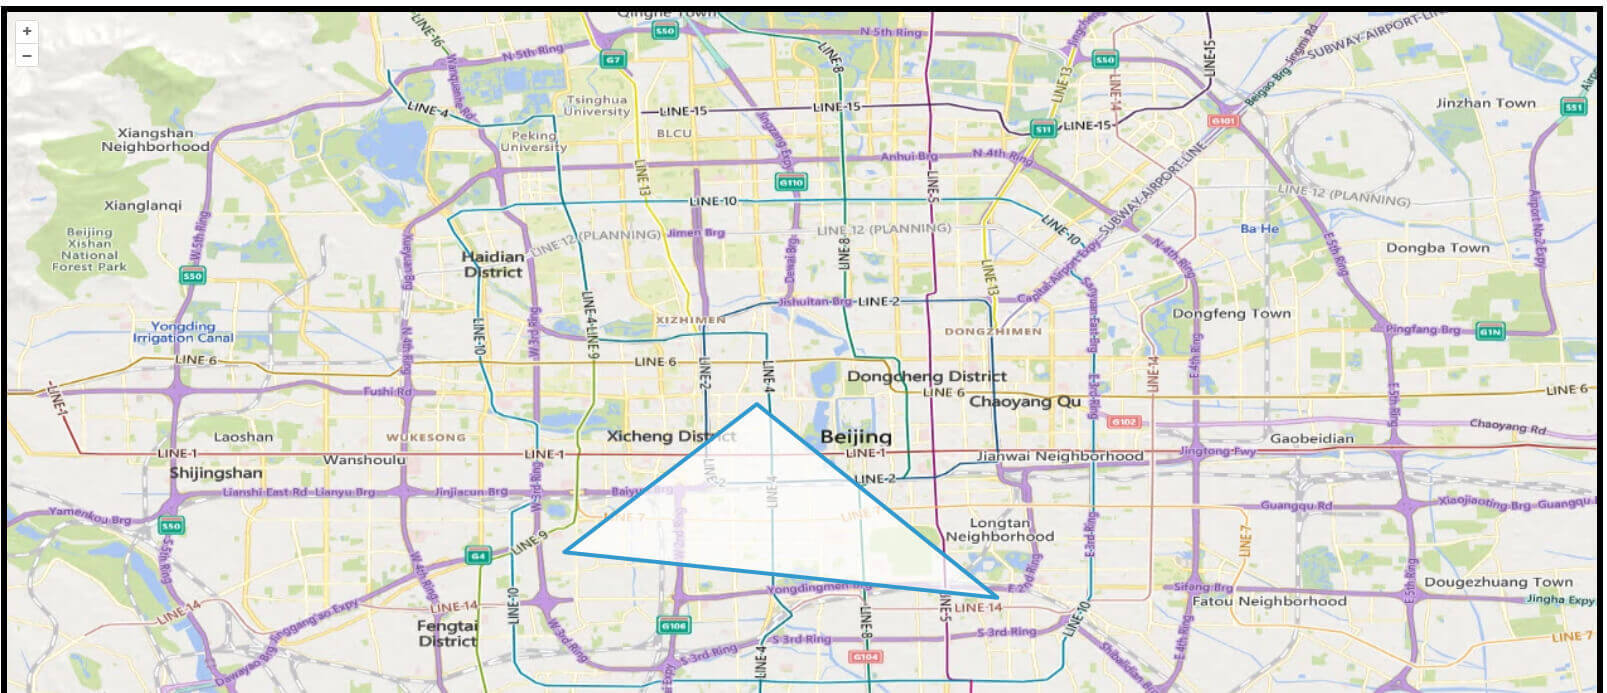
看看矢量三角形的上图的效果吧!
# 总结
- 点、线、面都是通过矢量数据上图的矢量图形;
- 点、线、面都是通过
Feature要素来创建; Style样式是对Feature要素生效;Geometry几何是对Feature要素的几何定义;
参考:https://www.osgeo.cn/gis-tutorial/ch02-02/sec04-4.html (opens new window)
武汉工作,会点Web,擅长Javascript.
技术或工作问题交流,可联系微信:1169170165.